Crop Counter
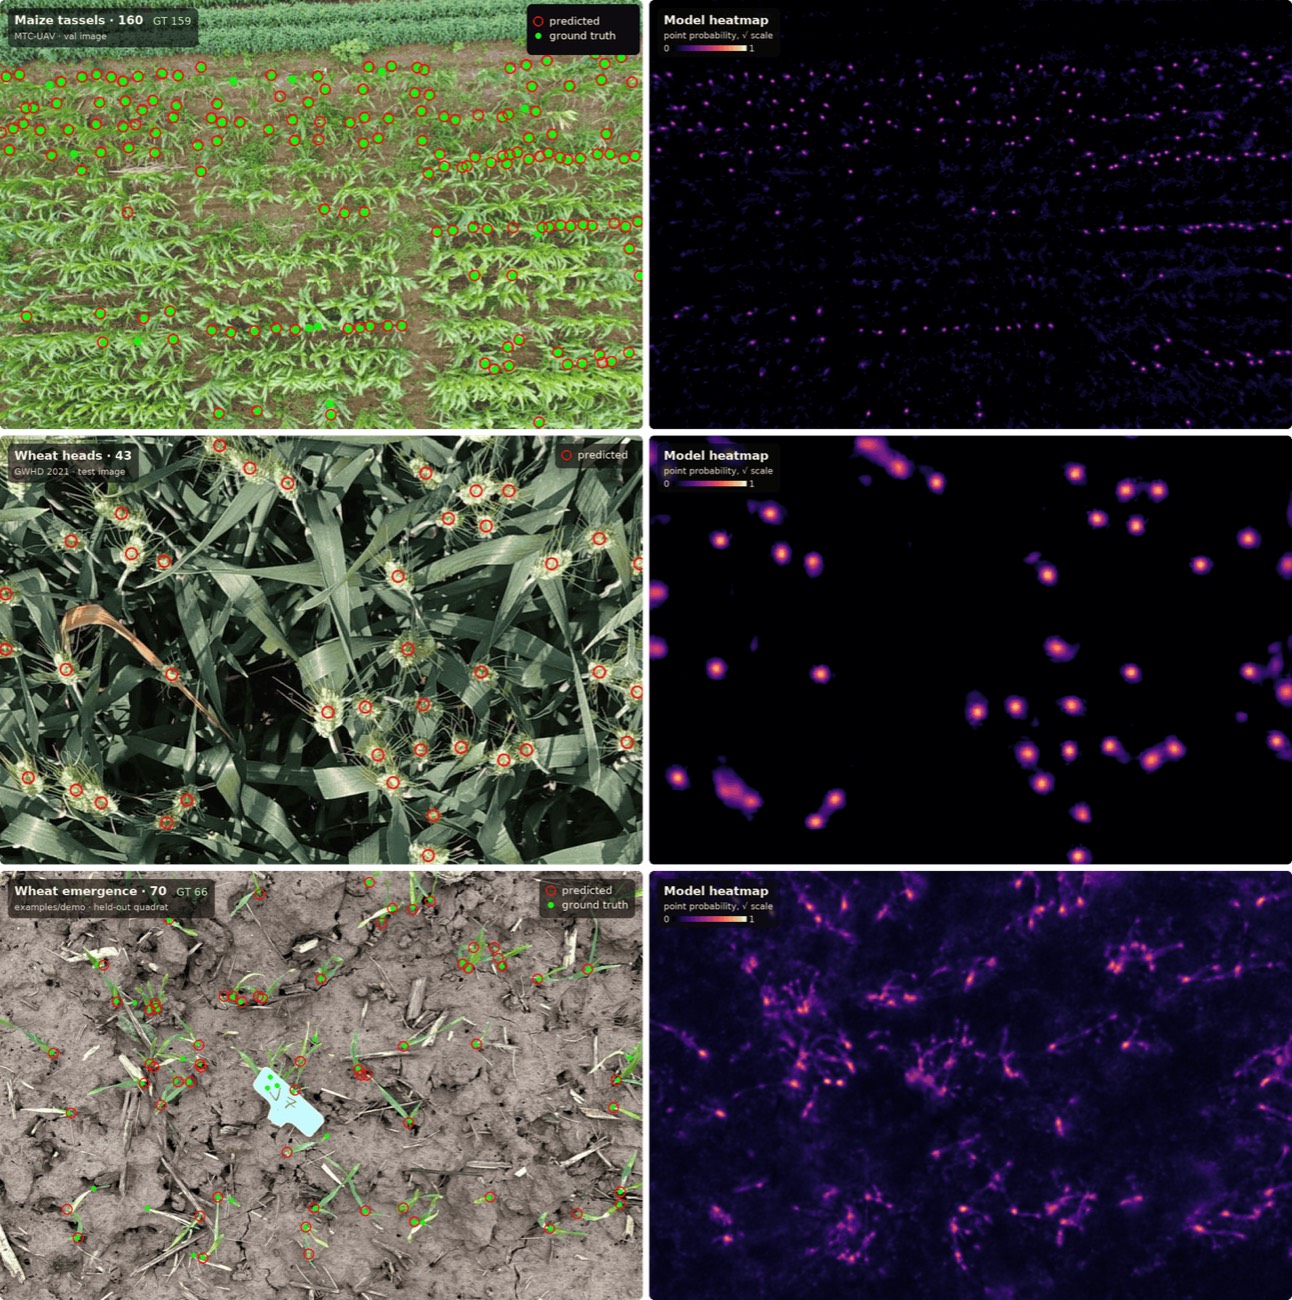
Crop Counter finds each plant in a top-down field photo and marks it as a point, so every count comes with the locations behind it. The code, training notebooks and trained wheat decoder are open source.
In Beta. Open source under AGPL-3.0. To use it commercially without the AGPL conditions, ask us about a commercial licence. The hosted wheat-count endpoint on our portal still runs the previous model, which returns a count only. Its API reference (endpoints, rate limits and errors) is in the repository.
What it's for
Plant establishment
Count emerged wheat plants in a quadrat photo and convert the count to plants per square metre. This is the task the shipped decoder was trained for.
Heads and tassels
The same code counts wheat heads and maize tassels. Both are worked examples in the repository, with notebooks, reports and trained decoders.
Your own crop
Label one point per plant in CVAT or COCO format and train a new decoder. The maize example trained in about 2 hours on one RTX 4070 Ti Super, and Apple Silicon is supported.
Architecture
The count comes from points the model has located: 43 means 43 peaks, each one at a place in the photo. A density model sums a map instead, and can reach the right total for the wrong reasons. Only the decoder is trained. The backbone’s large-scale pretraining handles texture and shape, so a few thousand point-labelled images are enough.
How an image becomes points. Shown with the default ConvNeXt-B backbone; the small and large backbones change the stage widths, not the layout. Every part is in dinov3_pyramid.py and heatmap.py.
Design choices
ConvNeXt, not a ViT
A hierarchical backbone gives real stride-4, 8, 16 and 32 maps for the decoder to fuse. With no positional embeddings it trains on 768 px tiles and runs on any image size divisible by 32.
A hybrid decoder
Uniform 1×1 laterals and a single fine-scale output come from FPN. Merging each step by concatenation and a double conv block, rather than adding, comes from U-Net.
Targets merged by max
Each labelled point becomes a Gaussian peak (σ 2 at stride 4). Overlapping peaks are merged by taking the maximum, never the sum, so two close plants stay two maxima with a dip between them.
Focal loss
A penalty-reduced focal loss in the CenterNet style (α 2, β 4) on the raw logits, normalised by the number of peaks. The head starts at p ≈ 0.02 everywhere so empty ground does not swamp early training.
τ set after training
The score threshold is swept on validation images once training ends, never fixed in advance. Each class can have its own threshold, read off one sweep.
Count and location scored apart
Count error (MAE, RMSE, bias) and location (precision, recall and F1 with one-to-one matching) are reported separately. A good count with a poor F1 means over- and under-counts cancelling out.
Model card
- Task
- Find and count individual plants, or parts of plants such as wheat heads and maize tassels, in top-down RGB images. One output channel per class, so one model can count several kinds of object.
- Inputs
- A top-down RGB image of any size whose sides divide by 32, such as a quadrat photo, a field-scout crop or a drone image. The model is fully convolutional, so it trains on fixed-size tiles and runs on whole images without tiling.
- Outputs
- A list of points, each with an (x, y) position, a class and a score, plus the count per class. Every counted plant is a point you can check on the photo. The heatmap behind the points comes out at a quarter of the input resolution.
- Architecture
- A frozen DINOv3 ConvNeXt backbone (base by default; small and large also supported) gives four feature maps at strides 4, 8, 16 and 32. A trained pyramid decoder projects each map to 192 channels with a 1×1 convolution, then works up from stride 32 to stride 4. At each step it upsamples by 2, concatenates the map at that stride and applies two 3×3 convolution, GroupNorm and GELU layers. A 1×1 head gives one logit channel per class. Points come from a local-maximum test, a score threshold τ and point non-maximum suppression.
- Size
- 3.36 million trained parameters, all in the decoder (a 13 MB checkpoint). The frozen backbone is Meta's DINOv3 ConvNeXt-B, a gated download from Meta that is not shipped with the code.
- Training data
- The shipped wheat emergence decoder: 1,153 point-annotated photos of emerging wheat in UK farm fields from autumn 2024, wheat and volunteer plants merged into one class, split by grower into 1,031 training and 122 validation photos. The worked examples train separate decoders on two public datasets: GWHD 2021 wheat heads (3,657 training images) and MTC-UAV maize tassels (200 training images).
- Headline metric
- MAE 8.59 · F1 0.729 Wheat emergence, shipped decoder: an average count error of 8.59 plants per photo, and F1 0.729 for locating each plant.
- How measured
- On 122 validation photos from growers whose photos were held out of training. The 1,153 labelled photos, training and validation together, average about 57 plants each. The checkpoint (lowest validation loss, epoch 24 of 50) and τ (swept to 0.35) were both chosen on these photos. F1 matches predicted to labelled points one-to-one within 24 px.
- Metric
- WDA 0.740 Wheat heads, GWHD 2021 test set: weighted domain accuracy 0.740 across 18 domains, with every prediction kept.
- How measured
- On 1,382 test images not used in training or tuning. A predicted point is correct if it falls inside an unmatched labelled box, taken in descending score order. Raising the score cut-off to 0.23, a value read off the test set itself, gives 0.742. The 2021 challenge's best entry scored 0.700 with box matching at IoU ≥ 0.5, which is a different rule.
- Metric
- MAE 14.4 · F1 0.902 Maize tassels, MTC-UAV drone images: an average count error of 14.4 tassels per image, and F1 0.902 for locating each tassel.
- How measured
- On the 106 validation images, about 207 tassels each. The dataset has no test split, and τ (0.3) and the best checkpoint (epoch 39 of 40) were chosen on these images.
Results
One trained decoder per task, on the same frozen backbone. Count error is the average absolute difference between predicted and labelled counts per image.
| Task | Data | Scored on | Count error | F1 | Notes |
|---|---|---|---|---|---|
| Wheat emergence | 1,153 farm photos, private | 122 val | 8.59 | 0.729 | Shipped decoder. τ 0.35, swept on the same photos |
| Wheat heads | GWHD 2021, public | 1,476 val | 2.63 | 0.879 | τ 0.2, NMS radius 5. Test set: WDA 0.740 |
| Maize tassels | MTC-UAV, public | 106 val | 14.4 | 0.902 | τ 0.3, NMS radius 5, 1,536 px tiles |
A 13-epoch retrain of the wheat emergence recipe with the packaged code, about 3 hours on an Apple M-series laptop, reached 8.64 and 0.726 on the same 122 photos. The full reports are in the repository’s examples.
Limits
- The scores are optimistic. For wheat emergence and maize tassels, τ and the best checkpoint were chosen on the same images that were scored, and there is no separate test set. Only the wheat-head example has one.
- τ is a decode-time setting, not something the model learns, and it has to be calibrated for each dataset and class. The same wheat weights give an average count error of 13.83 at τ 0.3 and 8.59 at τ 0.35.
- The wheat-head score uses our own point-in-box matching, adapted from the 2021 challenge's box matching at IoU ≥ 0.5, so it is not a like-for-like comparison with that leaderboard.
- On maize tassels it counts less accurately than TasselNetV3 (average error 14.4 against 8.8 tassels per image). TasselNetV3 does not output a location for each tassel, so the localisation scores can't be compared.
- Smeared or blurred patches can be decoded as two points. The wheat-head and maize examples raised the NMS radius from 1.5 to 5 to stop this.
- Needs individual plants visible from above in colour photos. Multispectral, greenhouse and tray images are untested.
- The hosted wheat-count endpoint on the InsightML portal still runs the previous model, a density-map counter that returns a count only. To get points from this model today, run the open-source code.
Run it
Python 3.12 or later, on CUDA, Apple Silicon or CPU. You fetch the DINOv3 backbone from Meta yourself; python -m cropcounter.weights says where to put it. Then count the demo photos with the shipped decoder:
import torch
from cropcounter import (
    CropTileDataset, load_checkpoint, records_from_folder, predict_prob, decode_classes,
)

device = torch.device("mps")  # or "cuda" / "cpu"
model, cfg = load_checkpoint("weights/decoder_best.pt", device, weights_dir="weights")
model.eval()

images = "examples/demo/data/val/images"
records = records_from_folder(images)
dataset = CropTileDataset(records, images, train=False, output_stride=cfg.output_stride)

for record, item in zip(records, dataset):
    prob = predict_prob(model, item["image"], device)  # (1, C, h, w) heatmap
    points, scores, class_ids = decode_classes(
        prob, cfg.class_names, tau=0.35, k=cfg.k, nms_radius=cfg.nms_radius,
        output_stride=cfg.output_stride, width=record.width, height=record.height,
    )
    print(record.name, len(points), "plants")
Training a new decoder is one command, python -m cropcounter.train –config …. The code, the shipped decoder and the trained decoders for wheat heads and maize tassels are released under AGPL-3.0, so a service built on them has to publish its source too. For other terms, ask us about a commercial licence.
Credits
Built by InsightML: Freddie Allen-Stevens and Liam Cracknell. Wheat emergence photos from farmers in BOFIN’s SLIMERS programme, point-annotated by an annotation vendor; the 20-photo demo set is anonymised and published with the programme’s permission. The worked examples use the Global Wheat Head Dataset 2021 (David et al.) and MTC-UAV (Lu et al.). The backbone is Meta’s DINOv3, used under Meta’s own licence.