Virtual Quadrat
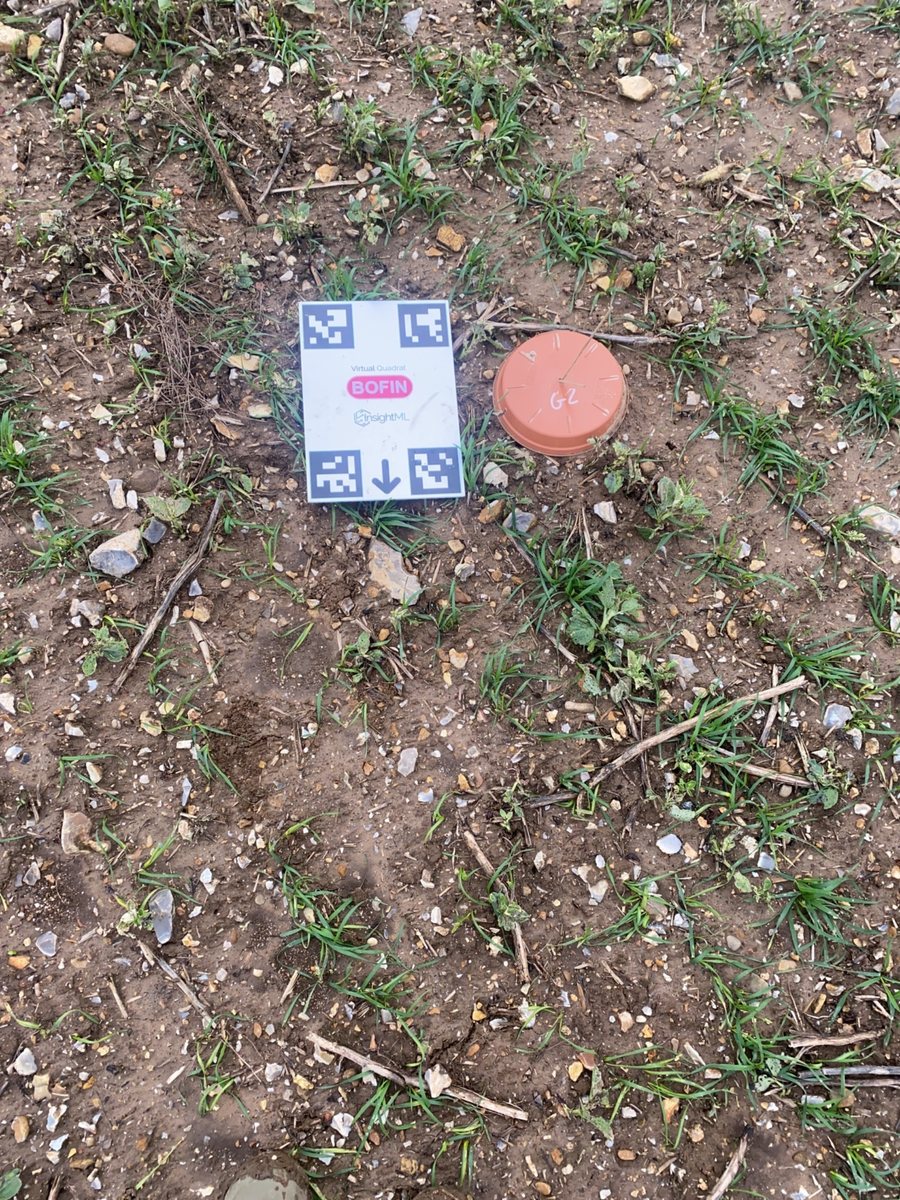
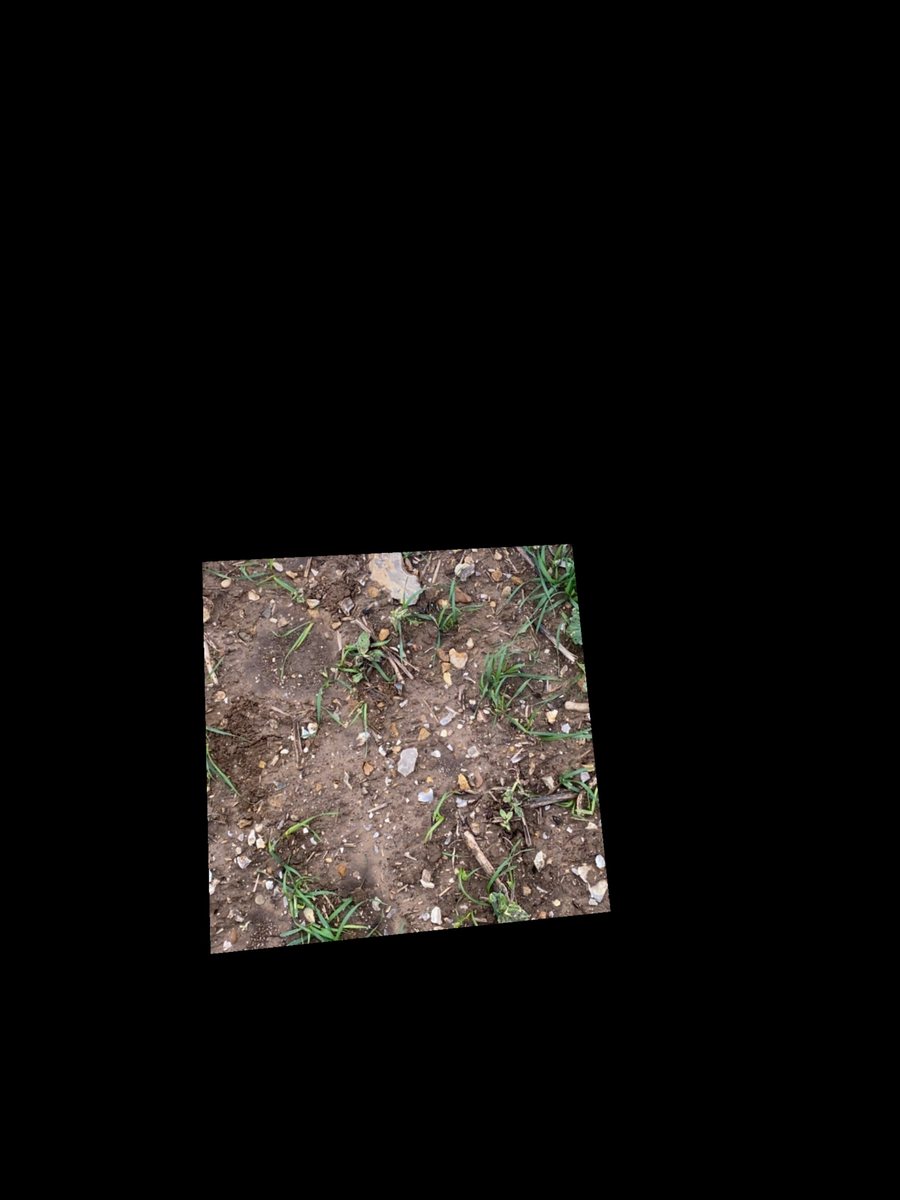
Virtual Quadrat finds a fixed square of ground next to a printed A4 card in a smartphone photo and blacks out everything else. Four markers on the card carry the geometry, so photos taken by different people on different farms are measured against the same nominal 0.25 m² of ground.
In BOFIN's farmer app since autumn 2025, and on InsightML's platform API since May 2026. Virtual Quadrat measures geometry from printed markers and has no trained model inside it. The released version blacks out the ground around the quadrat rather than cropping it.
What it's for
Count per square metre
Every photo is measured against the same nominal 0.25 m² (500 × 500 mm) of ground, so plant counts from different farms can be compared per square metre. The string quadrats laid by hand before varied significantly in size.
Catch a bad photo in the field
A check runs on the phone before upload. It looks for all four markers, a top-down angle and room below the card, so the farmer can retake the photo while still standing in the crop.
Give counting models a standard input
The Wheat Counter API passes each photo through Virtual Quadrat before counting, and turns away photos where the markers cannot be read. We plan to send quadrat images to annotators already cropped, so annotation points need no later coordinate conversion.
Tool card
- Task
- Find a fixed area of ground next to the printed A4 card in a phone photo, and return the photo with everything outside that area blacked out. A separate endpoint returns the whole photo warped to a top-down view.
- Inputs
- A smartphone photo of the ground with the printed A4 card in frame, all four corner markers uncovered and space left below the card.
- Outputs
- The original photo, full size and still in perspective, with everything outside the quadrat blacked out. By default the quadrat is a 500 mm square starting 80 mm below the card. A second endpoint returns the whole photo warped to a top-down view, so a user can mark their own area in millimetres. A true crop, a top-down quadrat image and a pixels-per-centimetre scale are built and not yet released.
- Method
- No trained model. OpenCV finds the four ArUco markers, which are printed square codes. One corner of each gives four points for a perspective transform to a top-down view in millimetres, and the quadrat is placed at a fixed offset from the card. Detection parameters were tuned by hand so the phone check and the server agree, both on OpenCV 4.11.0.
- Training data
- None. It is a deterministic tool. The photos it processes are the input for models that sit on it, such as our wheat counter.
- Headline metric
- 96% 1,592 of 1,658 field photos returned a quadrat.
- How measured
- Autumn 2025 wheat photos from BOFIN farmers, re-run in August 2026 and counted with duplicate files removed. A separate check in October 2026 with the production marker detection gave the same count. Of the 66 failures, 64 had a marker that could not be read with the card in frame, and 2 found five markers. This measures how often a quadrat comes back. Accuracy is the next row.
- Accuracy
- Not yet checked against a measured square on the ground. As a consistency check on 1,123 photos that processed cleanly, mostly from the 2025 season, the four-corner fit sat a median 12.7 mm (95th percentile 33.5 mm) from a fit that uses all 16 marker corners.
- Scale so far
- 1,658 field photos from a five-week monitoring programme with BOFIN farmers in autumn 2025. In use in BOFIN’s farmer app since then, and on InsightML’s platform API since May 2026.
Limits
- All four markers must be read. In the 2025 season 66 of 1,658 photos (4%) gave no quadrat, and in 64 of them a marker could not be read although the card was in frame. In a hand review of 65 failed photos, grass, straw or dirt crossed the missing marker in 29 and shadow in 8, and 25 showed no visible cause. A way to recover these photos is being tested and is not in use.
- The quadrat has not been checked against a measured square on the ground. On 1,123 clean photos the four-corner fit sat a median 12.7 mm from a 16-corner fit of the same photo. The fit takes one corner from each marker and reaches about 800 mm from markers 136 mm apart, so a sub-pixel shift at a marker corner moves the quadrat by around 10 mm.
- The printed card artwork and the marker spacing the software uses disagree by about 3%. If the artwork is right, the nominal 500 mm square is closer to 485 × 488 mm. This is reported and not yet resolved.
- The released version returns the original photo, full size and still in perspective, with the ground outside the quadrat blacked out. On three test photos the quadrat filled only 13 to 17% of the returned image. A true crop, a top-down quadrat image and a pixels-per-centimetre scale are built and in testing.
- Virtual Quadrat standardises the photo and counts nothing. Between 2024 and 2025 the spread of the wheat counter's predicted counts per photo fell from 27.5 across 1,715 photos from 2024 to 13.3 across 1,605 from 2025. Our report attributes much of this to the model, trained on 2024 string-quadrat photos, pulling towards its average on unfamiliar images. There are no hand counts from 2025 to confirm it, so absolute counts from that season should not be quoted.
- The phone check depends on OpenCV.js 4.11.0, an 11.4 MB library. Newer versions find the same markers but break the way the check starts up. A trimmed build, 0.55 MB when compressed, passed tests on four photos with known answers and is not in use yet.
- Field use so far is mostly wheat on UK arable farms. Other crops and habitats are largely untested. A card placed upside down fails, and the phone check rejects photos taken at too steep an angle.
How it works
Lay the card
The printed A4 card goes on the ground next to the crop. Its four ArUco markers sit at known positions, and the quadrat lies in a fixed place below it.
Phone check
Before upload, a check in the app looks for all four markers, a top-down angle and room below the card. A failed check asks for a retake on the spot.
Find markers
On the server, OpenCV looks for the four markers using parameters tuned to agree with the phone check. Fewer or more than four markers and the photo is rejected with a reason.
Place the quadrat
One corner of each marker gives four points, enough to work out the geometry in millimetres and place the quadrat at a fixed offset from the card.
Return quadrat
The default 500 mm square, or an area the user marks in millimetres, is mapped back onto the original photo, and everything outside it is blacked out. The result goes to a counting model.
Select a stage to see the detail.
Build story
Virtual Quadrat: a fixed square of ground in every field photo
How a printed card turned farmers' phone photos into measurements of the same area, what the first season in the field showed, and what still goes wrong.
Why a printed card
In 2024, farmers photographed young wheat inside string quadrats laid by hand, and we counted the plants in each photo. That season gave 1,715 photos from 20 farmers.
The area inside the string varied significantly between photos, which confused the per-area calculation. A printed card lets software measure the area from the photo itself, so every photo covers the same nominal area.
One card, two matching detectors
An A4 card carries four ArUco markers, square printed codes used in robotics to locate a camera. Software that finds the markers can work out how the phone was tilted and map the photo to a top-down view.
We wrote the detection twice. A JavaScript version runs on the phone and checks a photo before upload. A Python version runs on the server and finds the quadrat. The two must agree, so their parameters were tuned by hand on the same version of OpenCV.
The first season in the field
BOFIN farmers used the card through BOFIN’s farmer app in a five-week monitoring programme, and plant counts went back to them by email.
When we re-ran the season’s 1,658 photos in August 2026, 1,592 returned a quadrat (96%). In 64 of the 66 failures a marker could not be read although the card was in frame. We heard from the field that a single blade of grass over a marker could be enough. One grower found leaves at the edge of the card hard to keep off the markers, and expected to need a larger board behind it within a few weeks.
Testing a learned backup detector
We trained a small pose-estimation network to find the four markers, as a backup for when the marker detector fails.
We scored it only against the marker method, on photos the marker method already handled, and those overlapped the photos it learned from. That says little about the photos that actually fail, so we do not quote its scores. The backup has not been used in production.
From one app to a standalone tool
BOFIN asked for a way to collect bean photos with Virtual Quadrat for a planned bean counter. We kept the farmer route inside BOFIN’s app, so farmers had one place to go, and built a separate route on InsightML’s portal for businesses running their own trials.
We packaged the code as a library, added portal documentation and an interactive tool for laying out a quadrat, and moved it onto our shared platform API in May 2026. Users can now set their own quadrat in millimetres.
Lessons from the wheat model, and a second card
Our report on the 2024 and 2025 seasons looked at the wheat counter, which was trained on 2024 string-quadrat photos. The spread of predicted plants per photo fell from 27.5 across 1,715 photos from 2024 to 13.3 across 1,605 from 2025. The report attributes much of this to the model pulling towards its average on unfamiliar images, and notes that more uniform photos would also narrow the spread. With no hand counts from 2025, it argues that rankings between farms remain usable and absolute counts do not.
A second version of the card followed in July, in a standard and a grid design. A model review in August asked for a true crop and a scale in pixels per centimetre. Both are built and tested on three field photos, and are not released yet.
Shrinking the phone check
The phone check loads OpenCV.js, an 11.4 MB library. We built a trimmed version with only the parts the check uses. Compressed, the download falls from 2.76 MB to 0.55 MB.
The first trimmed build contained no marker detection at all, yet it built without an error. We caught it because every build was graded against four photos with known answers. Newer OpenCV.js versions found the same markers but broke the way the check starts up, so 4.11.0 stays the supported version. The trimmed build is not in use yet.
Recovering photos with an unreadable marker
We tried to recover photos with a covered marker in software, without changing the card. We wrote down the pass marks before running anything, and set aside 472 photos from six uploaders the method had never seen, run once.
We added artificial covers to those held-out photos. With one marker up to half covered (1,511 test cases), 35% came back within 5 mm of the normal result, against a target of 90%. With two markers each a tenth covered (569 cases), 1.41% came back wrong without warning, against a limit of 1%. Both pass marks failed.
On 65 real failed photos, the method returned a quadrat for 29 and rejected the other 36 with a clear reason instead of guessing. Whether those 29 are right is still to be checked against hand-labelled photos. It remains an experiment.
The same work found two things about the live tool. On 1,123 clean photos, the four-corner fit sat a median 12.7 mm from a fit using all 16 marker corners. The printed card artwork and the marker spacing the software uses also disagree by about 3%.
What's next
We plan to check recovered photos against hand-labelled ones, and then bring the phone check into line with any recovery that passes. We plan to release the true crop, the top-down quadrat image and the pixels-per-centimetre scale. We also plan to keep failed photos as a test set for future fixes, once the basis for using them is agreed. Settling the card measurement and checking the quadrat against a measured square on the ground are not yet scheduled.
Credits
Built by InsightML: Freddie Allen-Stevens. Field photos: BOFIN farmers, autumn 2025, through BOFIN’s farmer app. Marker detection: OpenCV (ArUco).